11 Dags
11.1 ⭐️Overview
This chapter is about creating DAGs in R.
Just throwing this in here for now. Needs a lot of work.
11.4 Using Dagitty to create other graphics
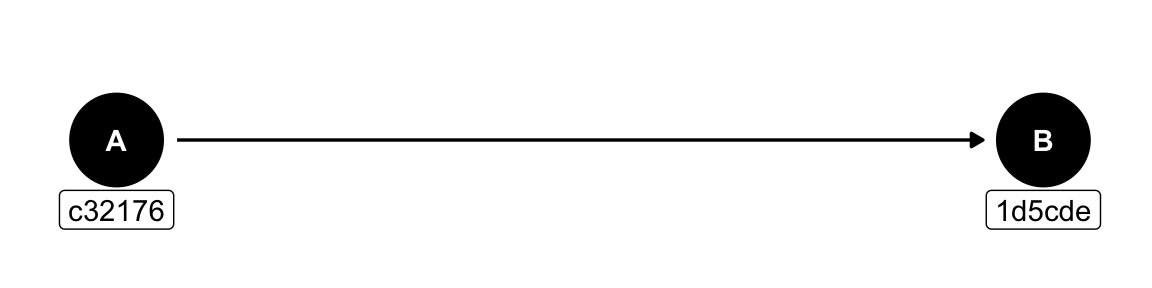
Dagitty was obviously developed to create DAGs, but it can also be used to create other node and edge graphics. For example, I used Dagitty to create graphics about git commits.
# Change the weight and width with the fig.height=1.5 and fig.width=6 code chunk options.

d1 <- dagify( # Use dagify() instead of dagitty()
  B ~ A, # The form is effect ~ cause
  labels = c( # Optionally create labels
    A = "c32176",
    B = "1d5cde"
  ),
  coords = list( # Adjust the layout by setting coordinates
    x = c(A = 1, B = 2),
    y = c(A = 0, B = 0)
  )
) %>%
  tidy_dagitty() # Turns it into a tibble

# Start with ggdag
ggdag(d1) +
  # Add labels and move them off the center of the node.
  # This took me a long to time to get right.
  geom_label(aes(x, y, label = label), vjust = 2.3) +
  theme_dag_blank()