
The codebookr package is intended to make it easy for users to create codebooks (also called data dictionaries) directly from an R data frame.
Under the hood, codebookr uses the flextable and officer packages extensively to create the codebook as a Word document.
Installation
You can install the released version of codebookr from CRAN with:
install.packages("codebookr")And the development version from GitHub with:
# install.packages("devtools")
devtools::install_github("brad-cannell/codebookr")
codebookr functions
codebook: The
codebook()function assists with the creation of a codebook for a given R data frame.cb_add_col_attributes: This is a helper function that makes it easier to add arbitrary attributes to R data frame columns (e.g., description, source, column type). These attributes can later be accessed by the
codebook()function to fill in the column attributes table for each column in the codebook.
Example 1: The most basic use case
We will start by demonstrating a complete, bare minimum example without any modification to our example data or any of the default values in the codebook() function. After walking through this example, we will demonstrate several ways to improve the codebook document by adding attributes to our data frame. We will also demonstrate the effects of adjusting some of codebook()s default values. Finally, we will demonstrate some techniques to make the codebook creation process more efficient in a couple of common use cases.
Let’s start by loading codebookr and dplyr.
library(codebookr)
library(dplyr, warn.conflicts = FALSE)
#> Warning: package 'dplyr' was built under R version 4.5.2
library(haven)
Load data
For the purposes of making a self-contained example, the codebookr package comes with a small example data frame that is intended to have some of the features of real study data. We will use it to demonstrate how to use codebookr below.
# Load example data
data(study)
glimpse(study)
#> Rows: 20
#> Columns: 10
#> $ id        <chr> "1001", "1002", NA, "1004", "1005", "1006", "1007", "1008", …
#> $ address   <chr> "101 A st.", "101 B st.", "101 C st.", "101 D st.", "101 E s…
#> $ sex       <fct> Female, Female, Female, NA, Female, Male, Male, Male, Female…
#> $ date      <date> 2021-10-12, 2021-09-23, 2021-10-13, 2021-10-19, NA, 2021-10…
#> $ time      <time> 08:56:40, 13:26:09, 09:24:22, 08:37:26, 09:20:59, 11:14:52,…
#> $ date_time <dttm> 2021-10-12 08:56:40, 2021-09-23 13:26:09, 2021-10-13 09:24:…
#> $ days      <int> 3, 15, 21, 5, 8, NA, 10, 18, 10, 12, 2, 10, 12, 20, 14, 17, …
#> $ height    <dbl> 81.25571, 68.15227, 58.79282, 72.81303, 69.61109, 71.05764, …
#> $ likert    <int> 5, 3, 4, 4, 1, 4, 1, 3, 4, 3, 5, 4, 4, 4, 1, 2, 3, 4, 3, 1
#> $ outcome   <lgl> TRUE, FALSE, FALSE, TRUE, TRUE, FALSE, TRUE, TRUE, FALSE, FA…
Pass the data frame to the codebook function
In this first example, we will simply pass the study data frame to the codebook() function without making any alterations. We will save the resulting rdocx object (described in greater detail below) in our global environment as the study_codebook object.
study_codebook <- codebook(study)Create the Word codebook document
Finally, we will pass the study_codebook object we just created to the print() function along with the path to Word document we want to create.
print(study_codebook, "basic_study_codebook.docx")Alternatively, you can generate the rdocx file and print it as a Word document in one step like this.
The code above produces the following document, which you can click to view/download on Dropbox. You may also download it from the files pane above.
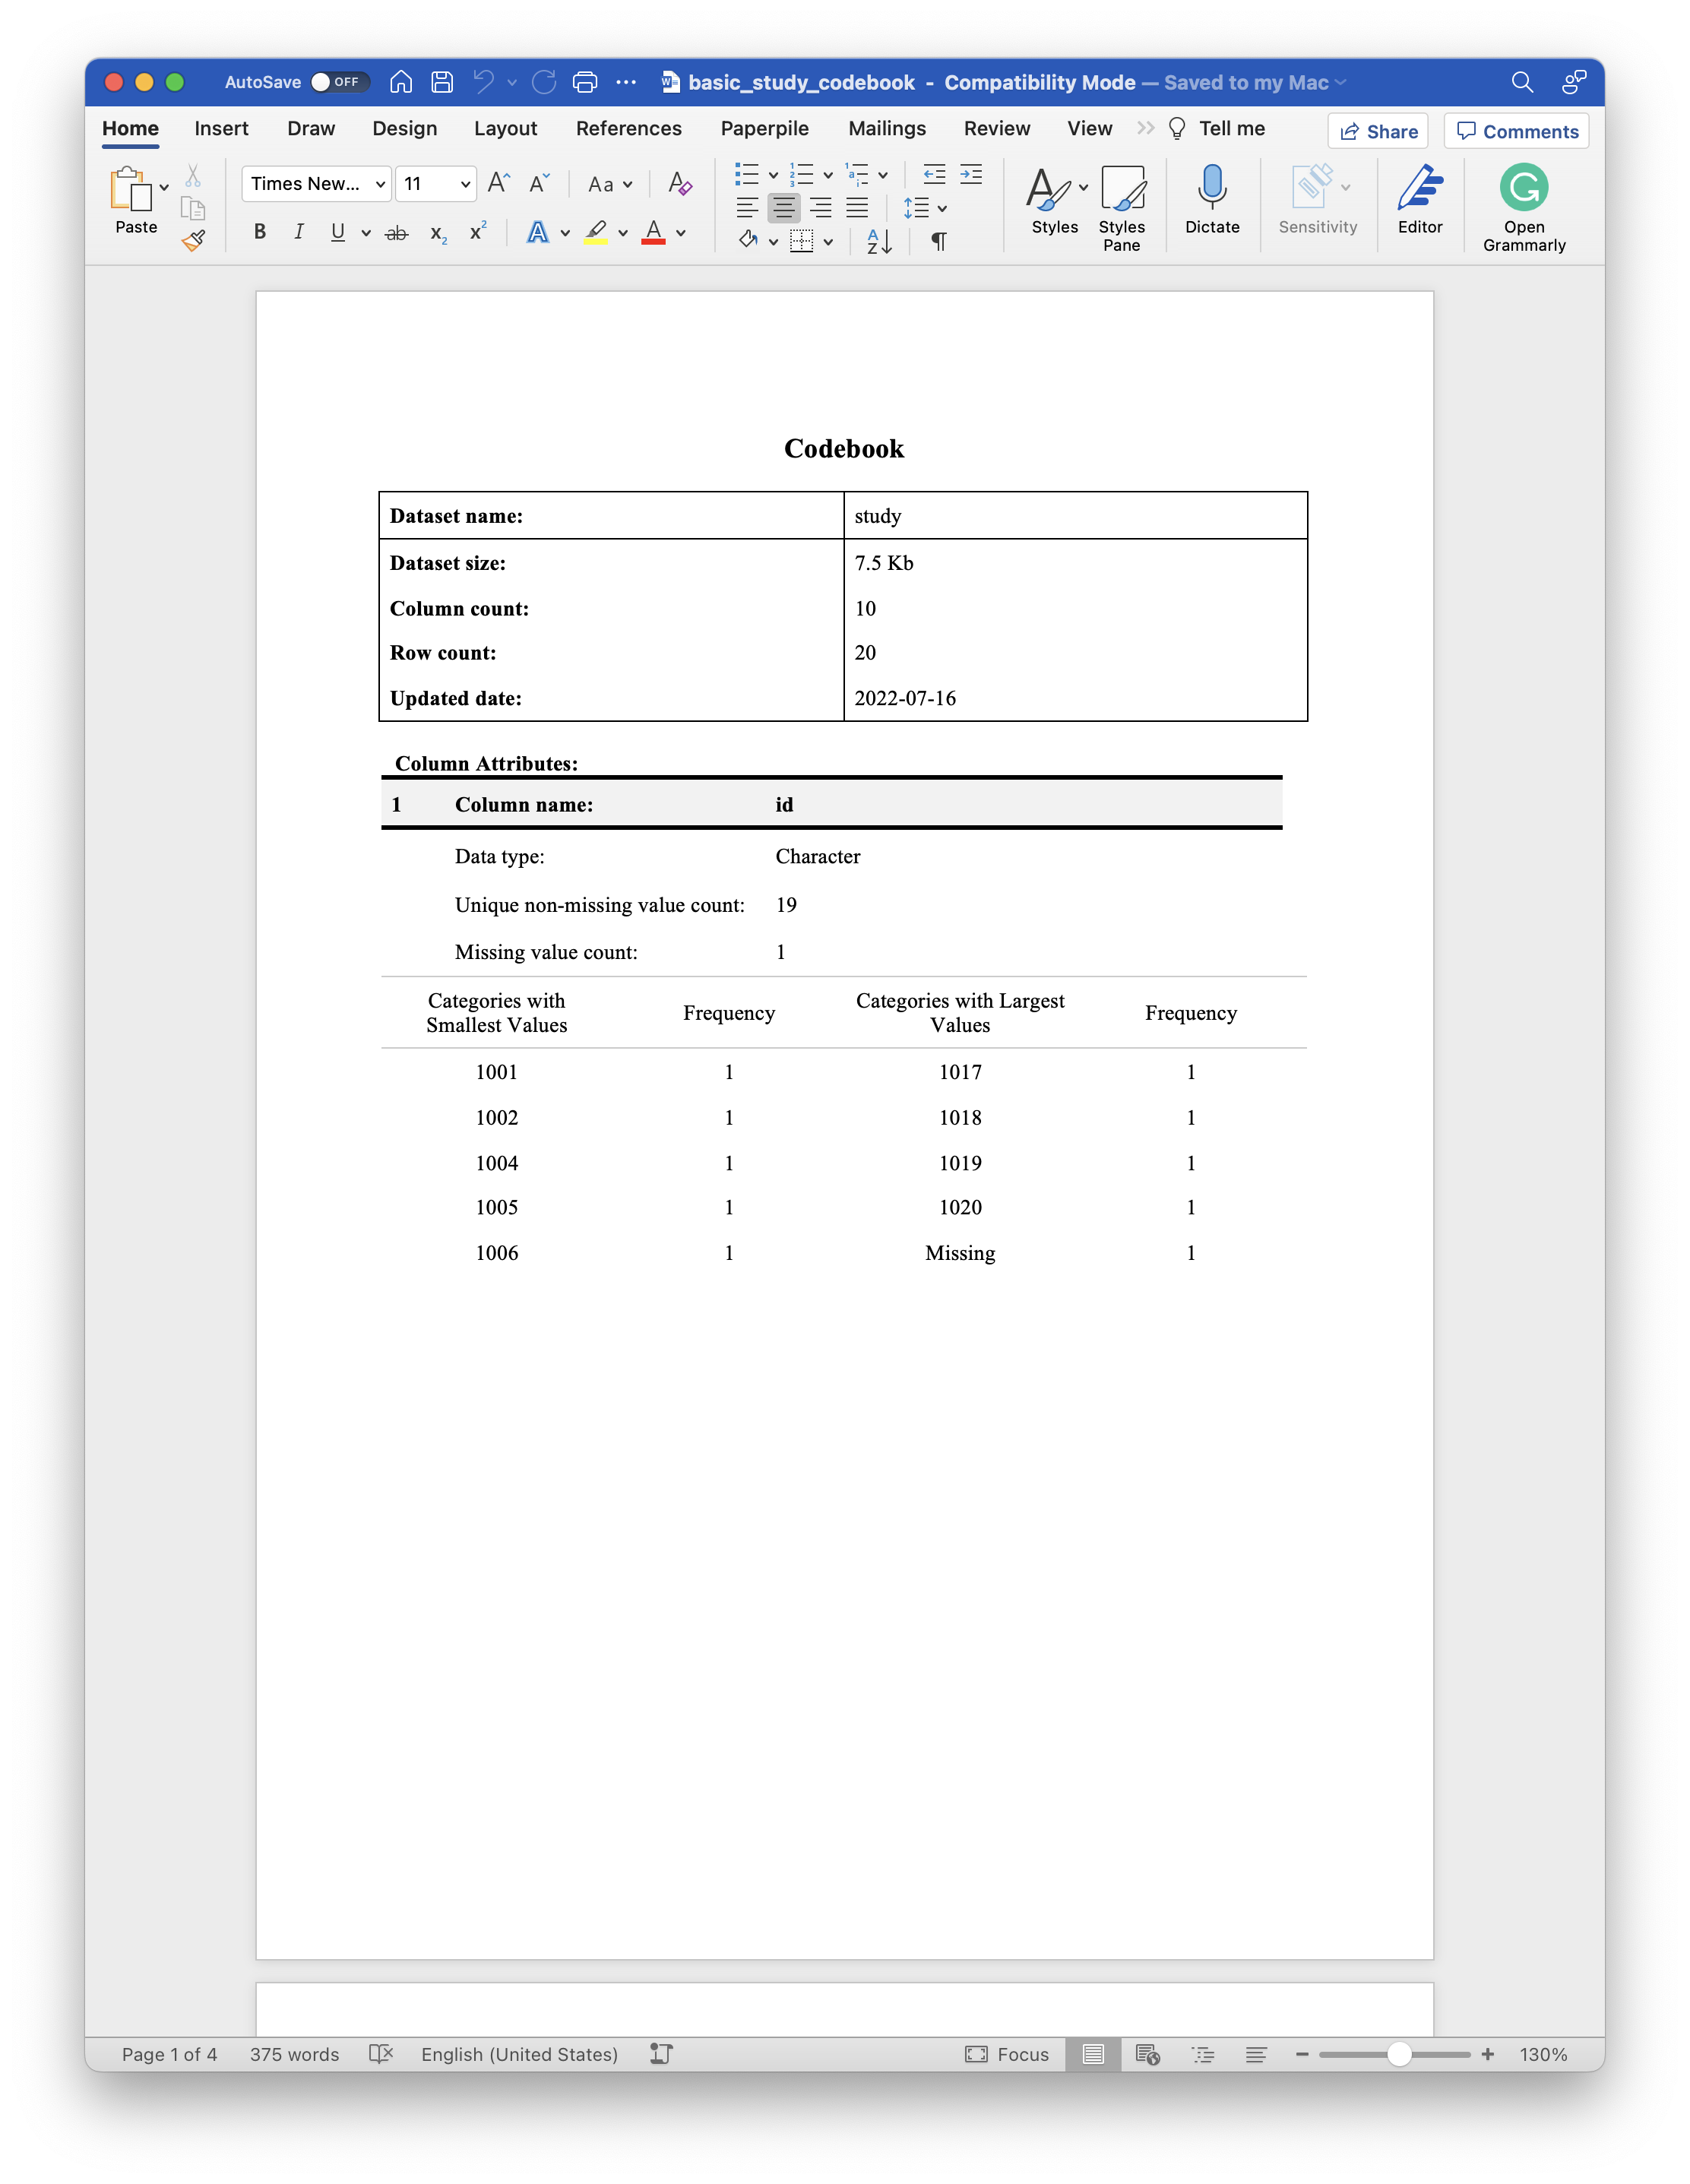
As you may see in the example document above, the default codebook document includes two major sections. They are:
A metadata table. This table includes some metadata about the data frame. Currently, the data frame’s name, size, number of columns, and number of rows are included in the metadata table. The final row of the metadata table gives the date when the codebook (but not necessarily the data frame) was last updated.
-
The column attributes tables. The codebook will include a tables of column attributes for each column in the data frame passed to the
codebook()function. By default, the top half of the column attributes table includes the column’s name, data type, the number of unique non-missing values, and the total number of missing values. Below, we will discuss other optional attributes that may be added to this table. The bottom half of each column attributes table will include some basic descriptive statistics. Which statistics are displayed depends on the what type of data the column contains. This is discussed in greater detail below.- The value for
Data typeis just the value returned by passing the column to base R’sclass()function. Below, we will discuss adding theColumn typeattribute, which allows the user to add additional information about the values in each column.
- The value for
Example 2: A more informative codebook
The previous example gave us a complete codebook, but there’s a lot of room for improvement. This example is still pretty simple, but it demonstrates how to use the codebookr package to make a codebook from a labeled data frame.
Once again, we will begin by loading the example study data.
# Load example data
data(study)
glimpse(study)
#> Rows: 20
#> Columns: 10
#> $ id        <chr> "1001", "1002", NA, "1004", "1005", "1006", "1007", "1008", …
#> $ address   <chr> "101 A st.", "101 B st.", "101 C st.", "101 D st.", "101 E s…
#> $ sex       <fct> Female, Female, Female, NA, Female, Male, Male, Male, Female…
#> $ date      <date> 2021-10-12, 2021-09-23, 2021-10-13, 2021-10-19, NA, 2021-10…
#> $ time      <time> 08:56:40, 13:26:09, 09:24:22, 08:37:26, 09:20:59, 11:14:52,…
#> $ date_time <dttm> 2021-10-12 08:56:40, 2021-09-23 13:26:09, 2021-10-13 09:24:…
#> $ days      <int> 3, 15, 21, 5, 8, NA, 10, 18, 10, 12, 2, 10, 12, 20, 14, 17, …
#> $ height    <dbl> 81.25571, 68.15227, 58.79282, 72.81303, 69.61109, 71.05764, …
#> $ likert    <int> 5, 3, 4, 4, 1, 4, 1, 3, 4, 3, 5, 4, 4, 4, 1, 2, 3, 4, 3, 1
#> $ outcome   <lgl> TRUE, FALSE, FALSE, TRUE, TRUE, FALSE, TRUE, TRUE, FALSE, FA…
Column types
Although R recognizes many different column types, most of which the study data contains, codebook() classifies all columns as one of four types and uses these categories to determine which descriptive statistics to use in the codebook document:
-
Categorical with many different categories, for example the
idcolumn of thestudydata frame.
-
Categorical with few different categories, for example the
sexcolumn of thestudydata frame.
-
Time, for example the
datecolumn of thestudydata frame.
-
Numeric, for example the
heightcolumn of thestudydata frame.
Here are the default summary statistics returned by the codebook() function for each of the column types list above:
Categorical variables with many different categories
| lowest_cats | lowest_freq | highest_cats | highest_freq |
|---|---|---|---|
| 1001 | 1 | 1017 | 1 |
| 1002 | 1 | 1018 | 1 |
| 1004 | 1 | 1019 | 1 |
| 1005 | 1 | 1020 | 1 |
| 1006 | 1 | Missing | 1 |
Categorical variables with few different categories
| cat | n | cum_freq | percent |
|---|---|---|---|
| Female | 11 | 11 | 55.00 |
| Male | 8 | 19 | 40.00 |
| Missing | 1 | 20 | 5.00 |
Add column attributes to the data frame you want to document with a codebook
Typically, though not necessarily (see What if the variables already have labels?), the first step in creating your codebook will be to add column attributes to your data. The cb_add_col_attributes() function is a convenience function that allows you to add arbitrary attributes to the columns of the data frame. These attributes can later be accessed to fill in the column attributes table of the codebook document. Column attributes can serve a similar function to variable labels in SAS or Stata; however, you can assign many different attributes to a column and they can contain any kind of information you want.
The arguments to cb_add_col_attributes() are:
-
df: The data frame containing the column you want to add the attribute to.
-
.x: The name of the column you want to add the attribute to in
df.
-
…: Arbitrary list of attributes in the form
attribute = "value".
Although the cb_add_col_attributes() function will allow you to add any attributes you want, there are currently only five special attributes that the codebook() function will recognize and add to the column attributes table of the codebook document. They are:
-
description: Although you may add any text you desire to the
descriptionattribute, it is intended to be used describe the question/process that generated the data contained in the column. Many statistical software packages refer to this as a variable label.- As demonstrated below, if the data was imported from SAS, Stata, or SPSS with variable labels using the
havenpackage,codebookwill automatically recognize them. There is no need to manually create them. However, you may overwrite the imported variable label for any column by adding adescriptionattribute as shown in the example below.
- As demonstrated below, if the data was imported from SAS, Stata, or SPSS with variable labels using the
source: Although you may add any text you desire to the
sourceattribute, it is intended to be used describe where the data contained in the column originally came from. For example, if the current data frame was created by merging multiple data sets together, you may want to use the source attribute to identify the data set it originates from. As another example, if the current data frame contains longitudinal data, you may want to use the source attribute to identify the wave(s) in which data for this column was collected.-
col_type: The
col_typeattribute is intended to provide additional information above and beyond theData type(i.e., column class) about the values in the column. For example, you may have a column of 0’s and 1’s, which will have a numeric data type. However, you may want to inform data users that this is really a dummy variable where the 0’s and 1’s represent discrete categories (No and Yes). Another way to think about it is that theData typeattribute is how R understands the column and theColumn typeattribute is how humans should understand the column. Currently accepted values are:Numeric,Categorical, orTime.- Perhaps even more importantly, setting the
col_typeattribute helps R determine which descriptive statistics to calculate for the bottom half of the column attributes table. Inside of thecodebook()function, thecb_add_summary_stats()function will attempt to figure out whether the column is numeric, categorical - many categories (e.g. participant id), categorical - few categories (e.g. sex), or time - including dates. Again, this matters because the table of summary stats shown in the codebook document depends on the valuecb_add_summary_stats()chooses. However, the user can directly tellcb_add_summary_stats()which summary stats to calculate by providing acol_typeattribute to a column with one of the following values:Numeric,Categorical, orTime.
- Perhaps even more importantly, setting the
-
value_labels: Although you may pass any named vector you desire to the
value_labelsattribute, it is intended to inform your data users about how to correctly interpret numerically coded categorical variables. For example, you may have a column of 0’s and 1’s that represent discrete categories (i.e., “No” and “Yes”) instead of numerical quantities. In many other software packages (e.g., SAS, Stata, and SPSS), you can layer “No” and “Yes” labels on top of the 0’s and 1’s to improve the readability of your analysis output. These are commonly referred to as value labels. The R programming language does not really have value labels in the same way that other popular statistical software applications do. R users can (and typically should) coerce numerically coded categorical variables into factors; however, coercing a numeric vector to a factor is not the same as adding value labels to a numeric vector because the underlying numeric values can change in the process of creating the factor. For this, and other reasons, many R programmers choose to create a new factor version of a numerically encoded variable as opposed to overwriting/transforming the numerically encoded variable. In those cases, you may want to inform your data users about how to correctly interpret numerically coded categorical variables. Adding value labels to your codebook is one way of doing so.Add value labels to columns as a named vector to the
value_labelsattribute. For example,value_labels= c(“No” = 0, “Yes” = 1). As another example, you may view hypothetical value labels added to thelikertcolumn below.As demonstrated below, if the data was imported from SAS, Stata, or SPSS with value labels using the
havenpackage,codebookwill automatically recognize them. There is no need to manually create them. However, you may overwrite the imported value labels for any column by adding avalue_labelsattribute as shown in the example below.
skip_pattern: Although you may add any text you desire to the
skip_patternattribute, it is intended to be used describe skip patterns in the data collection tools that impact which study participants were exposed to each study item. For example, If thelikertquestion in our hypothetical study data was only asked of participants who were enrolled in the study for at least 10 days, then you may want to add a note like “Not asked if days < 10” to the skip pattern section of the column attributes table.
study <- study %>%
  cb_add_col_attributes(
    id,
    description = "Participant's study identification number",
    source = "Administrative data",
    other_attribute = "What happens?"
  ) %>%

  cb_add_col_attributes(
    address,
    description = "Participant's home address",
    source = "Administrative data"
  ) %>%

  cb_add_col_attributes(
    sex,
    description = "Biological sex of the participant assigned at birth",
    source = "Sociodemographic questionnaire"
  ) %>%

  cb_add_col_attributes(
    date,
    description = "Participant's date of enrollment",
    source = "Administrative data"
  ) %>%

  cb_add_col_attributes(
    time,
    description = "Participant's time of enrollemnt",
    source = "Administrative data"
  ) %>%

  cb_add_col_attributes(
    days,
    description = "Total number of days the participant was enrolled in the study",
    source = "Calculated variable"
  ) %>%

  cb_add_col_attributes(
    height,
    description = "Participant's height in inches at date of enrollment",
    source = "Anthropometric measurements"
  ) %>%

  cb_add_col_attributes(
    likert,
    description = "An example Likert scale item",
    source = "Exposure questionnaire",
    value_labels = c(
      "Very dissatisfied" = 1,
      "Somewhat dissatisfied" = 2,
      "Neither satisfied nor dissatisfied" = 3,
      "Somewhat satisfied" = 4,
      "Very satisfied" = 5
    ),
    skip_pattern = "Not asked if days < 10"
  ) %>%

  cb_add_col_attributes(
    outcome,
    description = "Participant experienced the outcome of interest",
    source = "Adjudicated outcomes data"
  )
#> The following attribute(s) are being added to a variable in the data frame for the first time: description, source, other_attribute. If you believe this/these attribute(s) were previously added, then check for a typo in the attribute name. If you are adding this/these attribute(s) for the first time, you can probably safely ignore this message.
#> The following attribute(s) are being added to a variable in the data frame for the first time: value_labels, skip_pattern. If you believe this/these attribute(s) were previously added, then check for a typo in the attribute name. If you are adding this/these attribute(s) for the first time, you can probably safely ignore this message.
Notice that codebook() will print a message to the screen the first time you add an attribute to any column in the data frame. This is intended to help you catch typos. For example, if you add a description attribute to the column id you will get the following attribute(s) are being added to a variable in the data frame for the first time message. Later, if you add a description attribute to any other column, you should *NOT** get the following attribute(s) are being added to a variable in the data frame for the first time message again. However, if you accidentally added a descriptionn (typo – two n’s) attribute to another column in the data frame then you would get a message telling you that you added the descriptionn attribute for the first time. Because codebook() allows you to add any attribute to the data frame that you desire, it can’t check to make sure the attributes you are adding are “valid”. The best it can do is tell you when you are adding an attribute for the first time, and let you investigate further if you believe that you previously added that particular attribute.
Create a Word codebook document
Now that we’ve added a couple of attributes the data frame we want to document, we will once again pass the data frame to the codebook() function.
The arguments to the codebook() function are:
-
df: The saved file at
path, read into memory as a data frame.
-
title: An optional title that will appear at the top of the Word codebook document.
-
subtitle: An optional subtitle that will appear at the top of the Word codebook document.
- description: An optional text description of the dataset that will appear on the first page of the Word codebook document.
-
keep_blank_attributes: By default, the column attributes table will omit the Column description, Source information, Column type, value labels, and skip pattern rows from the column attributes table in the codebook document if those attributes haven’t been set. In other words, it won’t show blank rows for those attributes. Passing
TRUEto the keep_blank_attributes argument will cause the opposite to happen. The column attributes table will include a Column description, Source information, Column type, value labels, and skip pattern row for every column in the data frame - even if they don’t have those attributes set. - no_summary_stats: A character vector of column names. The summary statistics will not be added to column attributes table for any column passed to this argument. This can be useful when a column contains values that are sensitive or may be used to identify individual people (e.g., names, addresses, etc.) and the individual values for that column should not appear in the codebook.
First, we will once again create our codebook without passing any values to the title, subtitle, or description arguments. This will allow us to more easily see only the changes that were made to our codebook as a result of adding attributes to the columns. After viewing those changes, we will add a title, subtitle, and description.
study_codebook <- codebook(df = study)Technically, the codebook() function returns an rdocx object that can be printed to a Word document. This functionality comes from David Gohel’s incredible officer package. The final step in creating the Word document is to print it.
print(x = study_codebook, target = "study_codebook_1.docx")Where x is the rdocx object and target is a path for the Word document you want to create (which may or may not already exist). The code above produces the following document, which you can click to view/download on Dropbox. You may also download it from the files pane above.
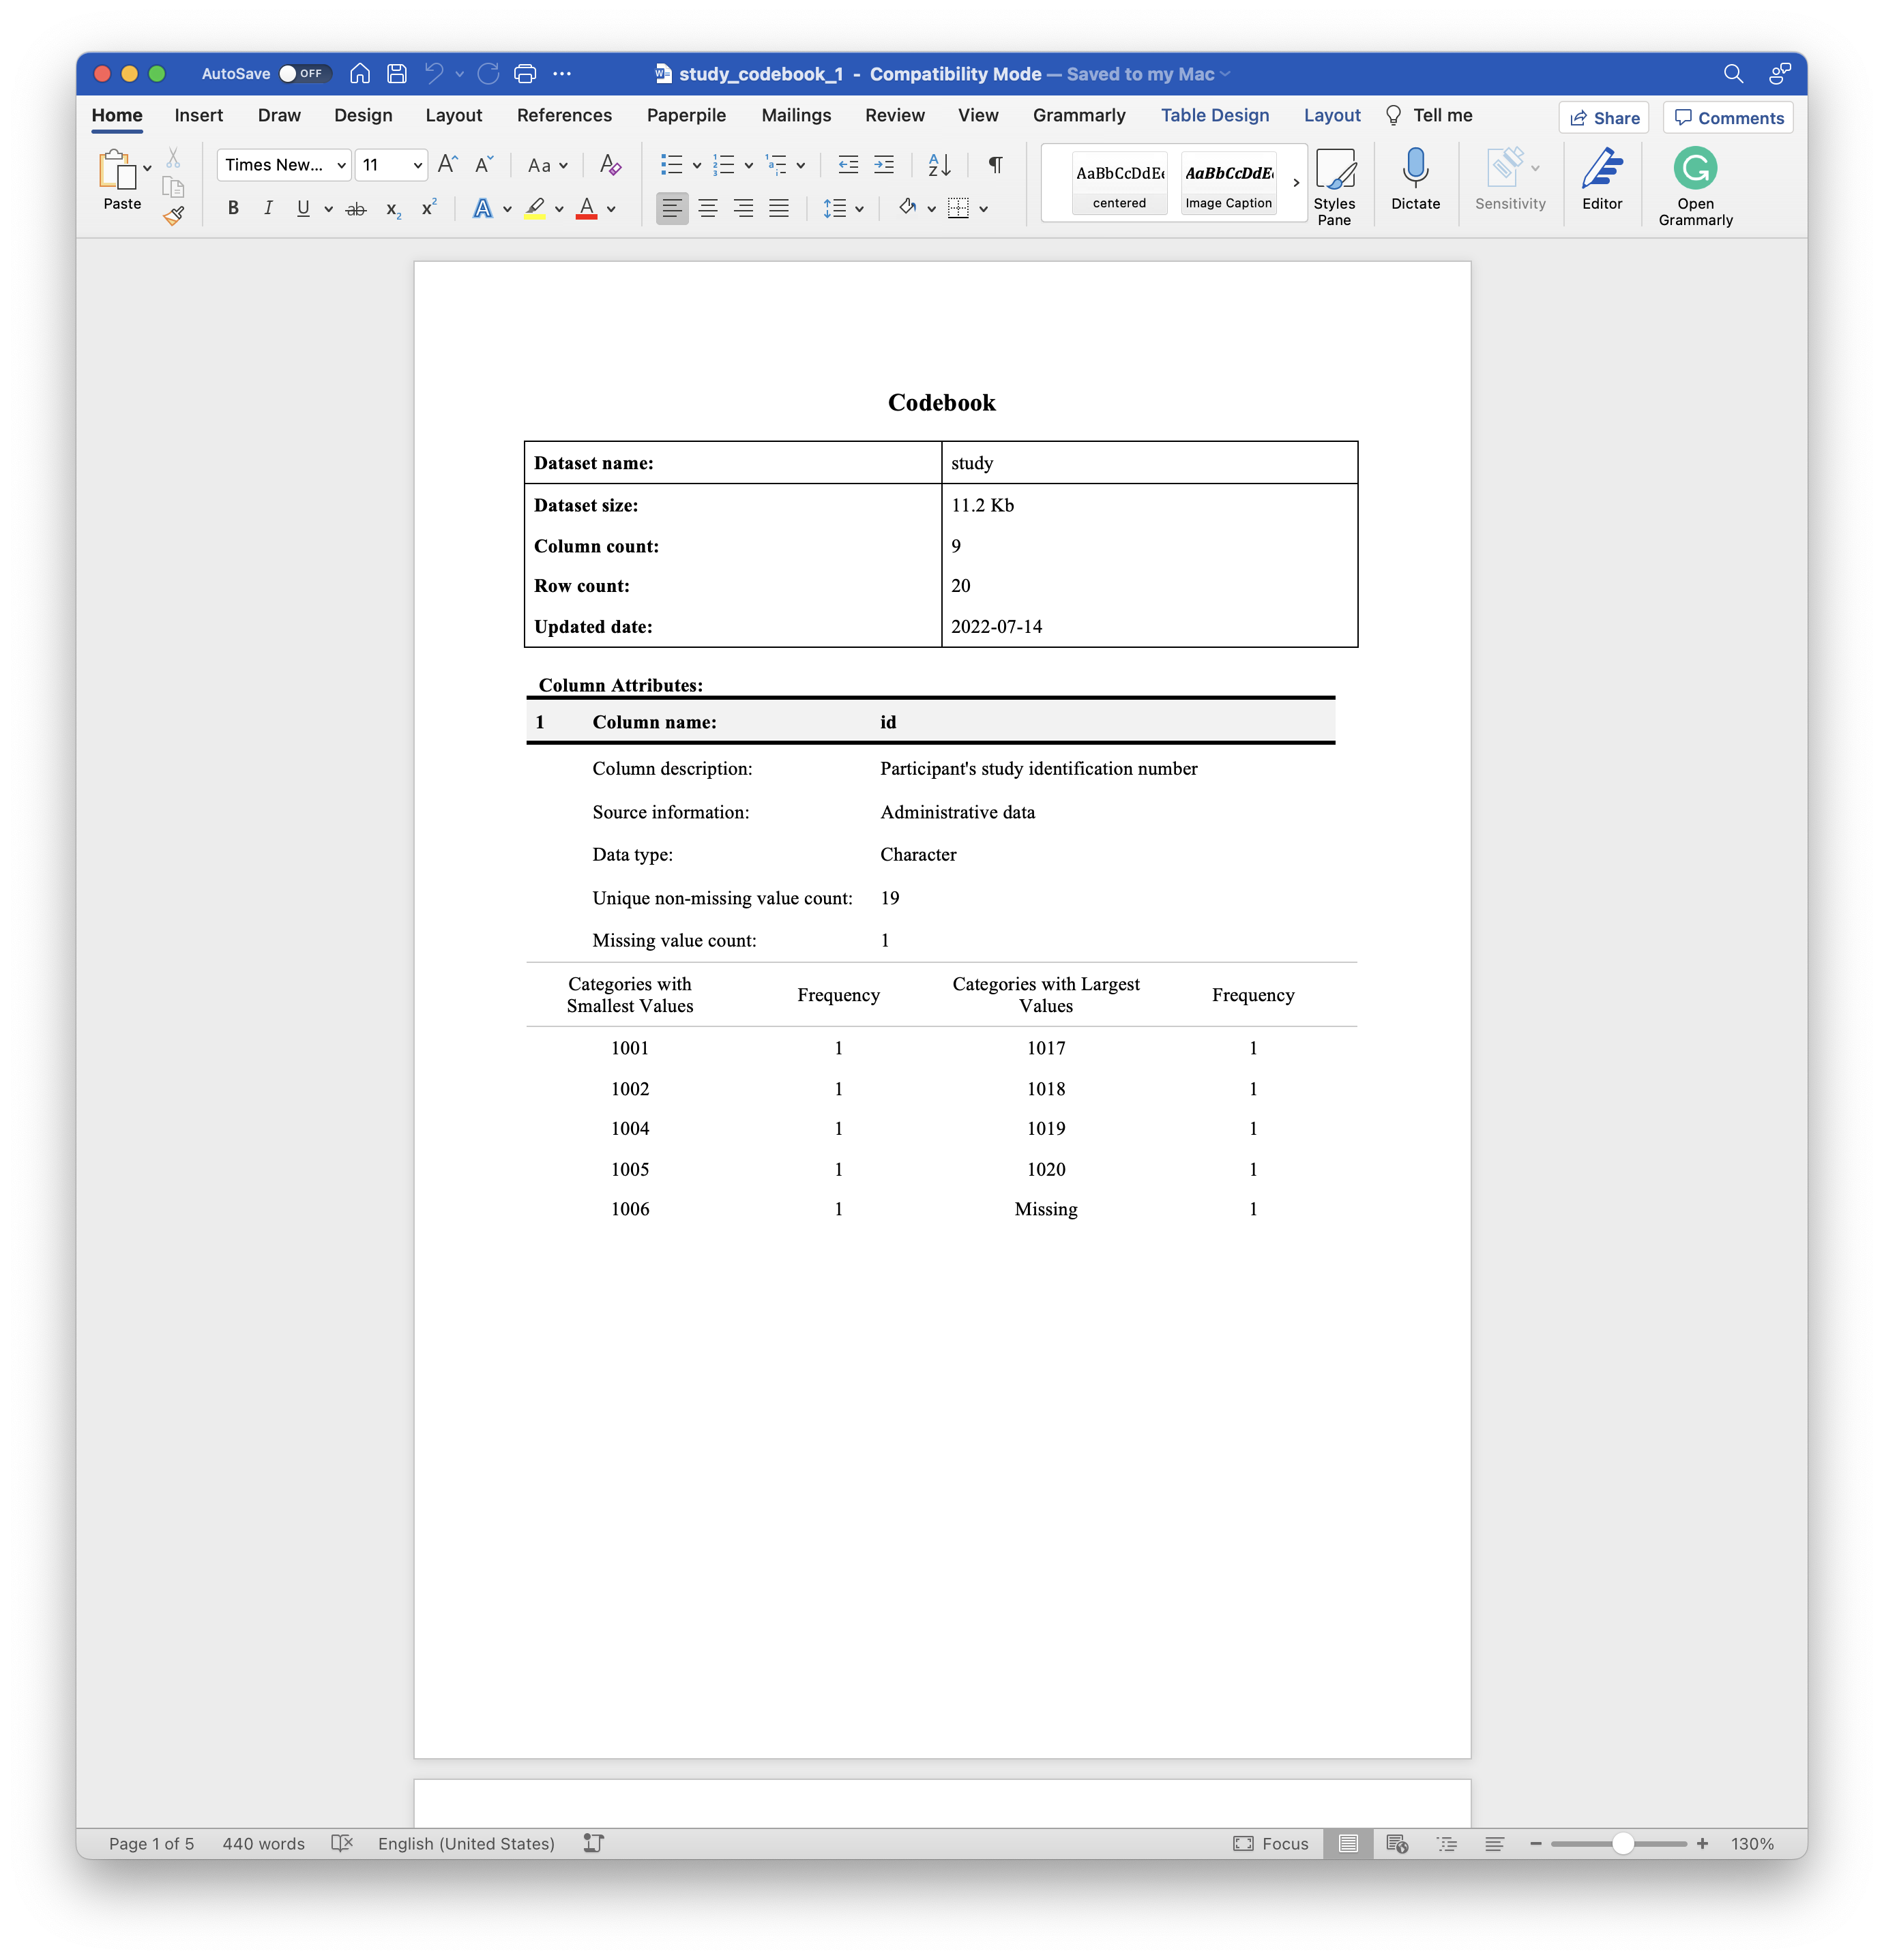
In the example above, the title and metadata table are unchanged compared to Example 1. However, the column attributes tables now look a little different.
Notice that the column attributes tables for each variable now includes the attributes that we added as column attributes above.
Notice that we added an
other_attribute = "What happens?"attribute to theidcolumn when we added column attributes above. That attribute is still attached to theidcolumn, but it is ignored bycodebook(). Again, there are currently only five special attributes that thecodebook()function will recognize and add to the column attributes table of the codebook document –description,source,col_type,value_labels, andskip_pattern.Notice that
codebook()guessed what type of values were contained in each column and returned the most useful descriptive statistics for that type. In this case we are may be very happy with these guesses. But what if we weren’t? For example, what if we would prefer forcodebook()to treat thelikertcolumn as categorical data instead of numeric data? We can do so by simply adding thecol_type = "Categorical"attribute as demonstrated below.
study <- study %>%
  cb_add_col_attributes(
    likert,
    col_type = "Categorical"
  )
#> The following attribute(s) are being added to a variable in the data frame for the first time: col_type. If you believe this/these attribute(s) were previously added, then check for a typo in the attribute name. If you are adding this/these attribute(s) for the first time, you can probably safely ignore this message.The code above produces the following document, which you can click to view/download on Dropbox. You may also download it from the files pane above.

As shown in the codebook above, the bottom half of the column attributes table now shows the frequency, cumulative frequency, and percentage for each value in the likert column. You may also notice that the value_labels and skip_pattern we applied above are also displayed in the column attributes table.
Add title, subtitle, and description
As previously mentioned, we can optionally add a custom title and subtitle to our codebook. We can also optionally add some descriptive text about our data overall. Doing so is straight forward. Just pass a string of text to each of the title, subtitle, and/or description arguments of the codebook() function. In the example below, we use a description from the DETECT project for example purposes only.
study_codebook <- codebook(
  df = study,
  title = "My Example Study",
  subtitle = "A Subtitle for My Example Study Codebook",
  description = "In collaboration with Texas Adult Protective Services (APS) and one of the largest mobile healthcare providers in North Texas — MedStar Mobile Healthcare (MedStar) — our team developed and piloted an EA screening tool: Detection of Elder Abuse Through Emergency Care Technicians (DETECT). The DETECT tool was designed specifically to help medics identify potential EA among community-dwelling older adults during an emergency response. DETECT relies entirely on the medics’ systematic observations of the older adults’ physical and social environment — no direct questioning of the older adult or their caregivers is involved. The intent was to create an EA screening tool that was easy for medics to use in the field and that helped medics capture information about older adults, their environments, and their caregivers that is thought to be associated with the occurrence of EA.

We pilot tested using the DETECT screening tool with medics in the field between September 17th and October 26th, 2015. During the pilot test, MedStar’s Electronic Patient Care Reporting system (ePCR) was programmed to automatically prompt all medics to complete an EA screening using the DETECT tool while on an eligible 911 response. An eligible 911 response was defined as a call for a community-dwelling patient who was 65 years of age or older, the setting was the patient’s residence, and the patient resided in the community (e.g., private home, unlicensed adult foster homes, unlicensed board and care homes, etc.). Other types of residences (e.g., licensed skilled nursing facilities) were excluded because reports of EA in these settings are generally not investigated by APS in Texas. By definition, older adults who participated in the pilot study had to live in MedStar’s service area of an estimated (978,000 residents), which included Fort Worth, Texas, and 14 surrounding communities."
)
print(study_codebook, "study_codebook_3.docx")The code above produces the following document, which you can click to view/download on Dropbox. You may also download it from the files pane above.

As shown in the codebook above, the codebook now contains a title, subtitle, and description.
What if you have a lot of variables?
If you have a lot of variables that you want to set attributes for, it can be tedious to manually type cb_add_col_attributes() for each of the variables like we did above.
Below, we demonstrate two techniques that can reduce some of the pain. Perhaps we will develop even better methods in the future.
# Load study again to remove the attributes we added above
data(study)
In the first example, we demonstrate setting an attribute for many variables at once. Let’s say that we want to set the source attribute to “Administrative Data” for the id, date, and time columns. We could do so with three separate calls to cb_add_col_attributes() for each variable as we did above, but that becomes a less tractable solution with many more than a handful of columns.
As a more efficient solution, we can create a vector of column names that we want to add an attribute to and then set the attribute value for each column in a for loop. We could just manually type the vector of column names, but we prefer using dplyr’s select() function as shown below because it is safer (e.g., it will throw an error if we type a variable name that doesn’t exist) and it offers the convenience of allowing us to use tidy-select selection features.
admin_vars <- study %>%
  select(id, date, time) %>%
  names()

for(i in admin_vars) {
  attr(study[[i]], "source") <- "Administrative data"
}
attributes(study$id)
#> $source
#> [1] "Administrative data"
attributes(study$date)
#> $class
#> [1] "Date"
#>
#> $source
#> [1] "Administrative data"
attributes(study$time)
#> $units
#> [1] "secs"
#>
#> $class
#> [1] "hms"      "difftime"
#>
#> $source
#> [1] "Administrative data"
In this second example, we will use a for loop to actually help us write a section of cb_add_col_attributes() code for each column in the data set. When we run the code chunk below, it will print R code to the screen that we can copy and paste into a second code chunk. This will cut down on the amount of typing we have to do and help ensure that we don’t accidentally forget to add attributes to any of the columns.
for (i in seq_along(names(study))) {
  cat(paste0('
    codebook_add_col_attributes( \n    ',
      "  ", names(study)[i], ', \n    ',
      "  ", 'description = ""
    ) %>%
  '))
}
#>
#>     codebook_add_col_attributes(
#>       id,
#>       description = ""
#>     ) %>%
#>
#>     codebook_add_col_attributes(
#>       address,
#>       description = ""
#>     ) %>%
#>
#>     codebook_add_col_attributes(
#>       sex,
#>       description = ""
#>     ) %>%
#>
#>     codebook_add_col_attributes(
#>       date,
#>       description = ""
#>     ) %>%
#>
#>     codebook_add_col_attributes(
#>       time,
#>       description = ""
#>     ) %>%
#>
#>     codebook_add_col_attributes(
#>       date_time,
#>       description = ""
#>     ) %>%
#>
#>     codebook_add_col_attributes(
#>       days,
#>       description = ""
#>     ) %>%
#>
#>     codebook_add_col_attributes(
#>       height,
#>       description = ""
#>     ) %>%
#>
#>     codebook_add_col_attributes(
#>       likert,
#>       description = ""
#>     ) %>%
#>
#>     codebook_add_col_attributes(
#>       outcome,
#>       description = ""
#>     ) %>%
#>
What if the variables already have labels?
It’s possible that you’re data already has column attributes that you want codebook() to use. For example, you may have a data frame that is imported from a binary file created by statistical analysis software other than R. In many cases, useful attributes such as variable labels and value labels are imported with the data.
In the example below, we import the same study data that we worked with above. However, this time we are importing it from a Stata data file using the read_dta() function from the haven package.
study <- read_dta("inst/extdata/study.dta")As shown below, if value labels, variable labels, and/or formats were added to the data in SAS, Stata, or SPSS then haven will attach them to the imported columns as label, format, and labels attributes respectively.
attributes(study$sex)
#> $label
#> [1] "Biological sex of the participant assigned at birth"
#>
#> $format.stata
#> [1] "%8.0g"
#>
#> $class
#> [1] "haven_labelled" "vctrs_vctr"     "double"
#>
#> $labels
#> Female   Male
#>      1      2
Additionally, haven will add the haven_labelled and vctrs_vctr class to any column that has value labels.
class(study$sex)
#> [1] "haven_labelled" "vctrs_vctr"     "double"
Fortunately, because we so often work with SAS, Stata, and SPSS data imported into R using haven, codebookr is built to take advantage of these imported attributes. Specifically, the codebook() function will add the value labels and variable labels to the column attributes table in the codebook document.
All we need to do is pass the data frame to the codebook() function and print the rdocx object as before.
The code above produces the following document, which you can click to view/download on Dropbox. You may also download it from the files pane above.

As shown in the codebook above, the Column description portion of the column attributes table is automatically populated with the value of the each column’s label attribute. Additionally, the Value labels portion of the column attributes table is automatically populated with the value of each column’s labels attribute; although, only the sex column has a labels attribute in this data frame.
What happens if there is a label and a description attribute?
For example, the id column below was imported with a label attribute. In the code chunk below, we also add a description attribute. Which one will end up in the codebook document?
study <- study %>%
  cb_add_col_attributes(id, description = "My new description")
#> The following attribute(s) are being added to a variable in the data frame for the first time: description. If you believe this/these attribute(s) were previously added, then check for a typo in the attribute name. If you are adding this/these attribute(s) for the first time, you can probably safely ignore this message.
attributes(study$id)
#> $label
#> [1] "Participant's study identification number"
#>
#> $format.stata
#> [1] "%9s"
#>
#> $description
#> [1] "My new description"The code above produces the following document, which you can click to view/download on Dropbox. You may also download it from the files pane above.

As shown in the codebook above, the Column description portion of the column attributes table is still automatically populated with the value of the each column’s label attribute – except where we manually added a description attribute. So, when a column has both a label and a description attribute, the description attribute wins out. The idea is that if we have taken the time to manually type out a description, it should win out over whatever happened to be in label.
What happens if there is a labels and a value_labels attribute?
The labels and value_labels attributes behave similarly to the label and descripion attributes shown above. The Value labels: portion of the column attributes table will automatically be populated with the value of the each column’s labels attribute – except where we manually add a value_labels attribute. So, when a column has both a labels and a value_labels attribute, the value_labels attribute wins out. The idea is that if we have taken the time to manually type out value_labels, it should win out over whatever happened to be in label.
Manually filling in the column attributes table
By default, codebook() will drop Column description:, Source information:, Column type:, Value labels:, and/or Skip pattern: from the column attributes table if values for those attributes don’t exist in the data frame. However, some users have requested the option to keep them in the Word codebook document with blank values so that that they can be filled in manually. We believe that this is typically a bad practice because any change to the data may require you to create a new codebook and fill-in the Word document manually from scratch again. However, changing the value of keep_blank_attributes from FALSE to TRUE will cause codebook() to keep Column description:, Source information:, Column type:, Value labels:, and Skip pattern: in the column attributes table even if those attributes don’t exist in the data frame.
# Refresh data
data(study)
study_codebook <- codebook(study, keep_blank_attributes = TRUE)
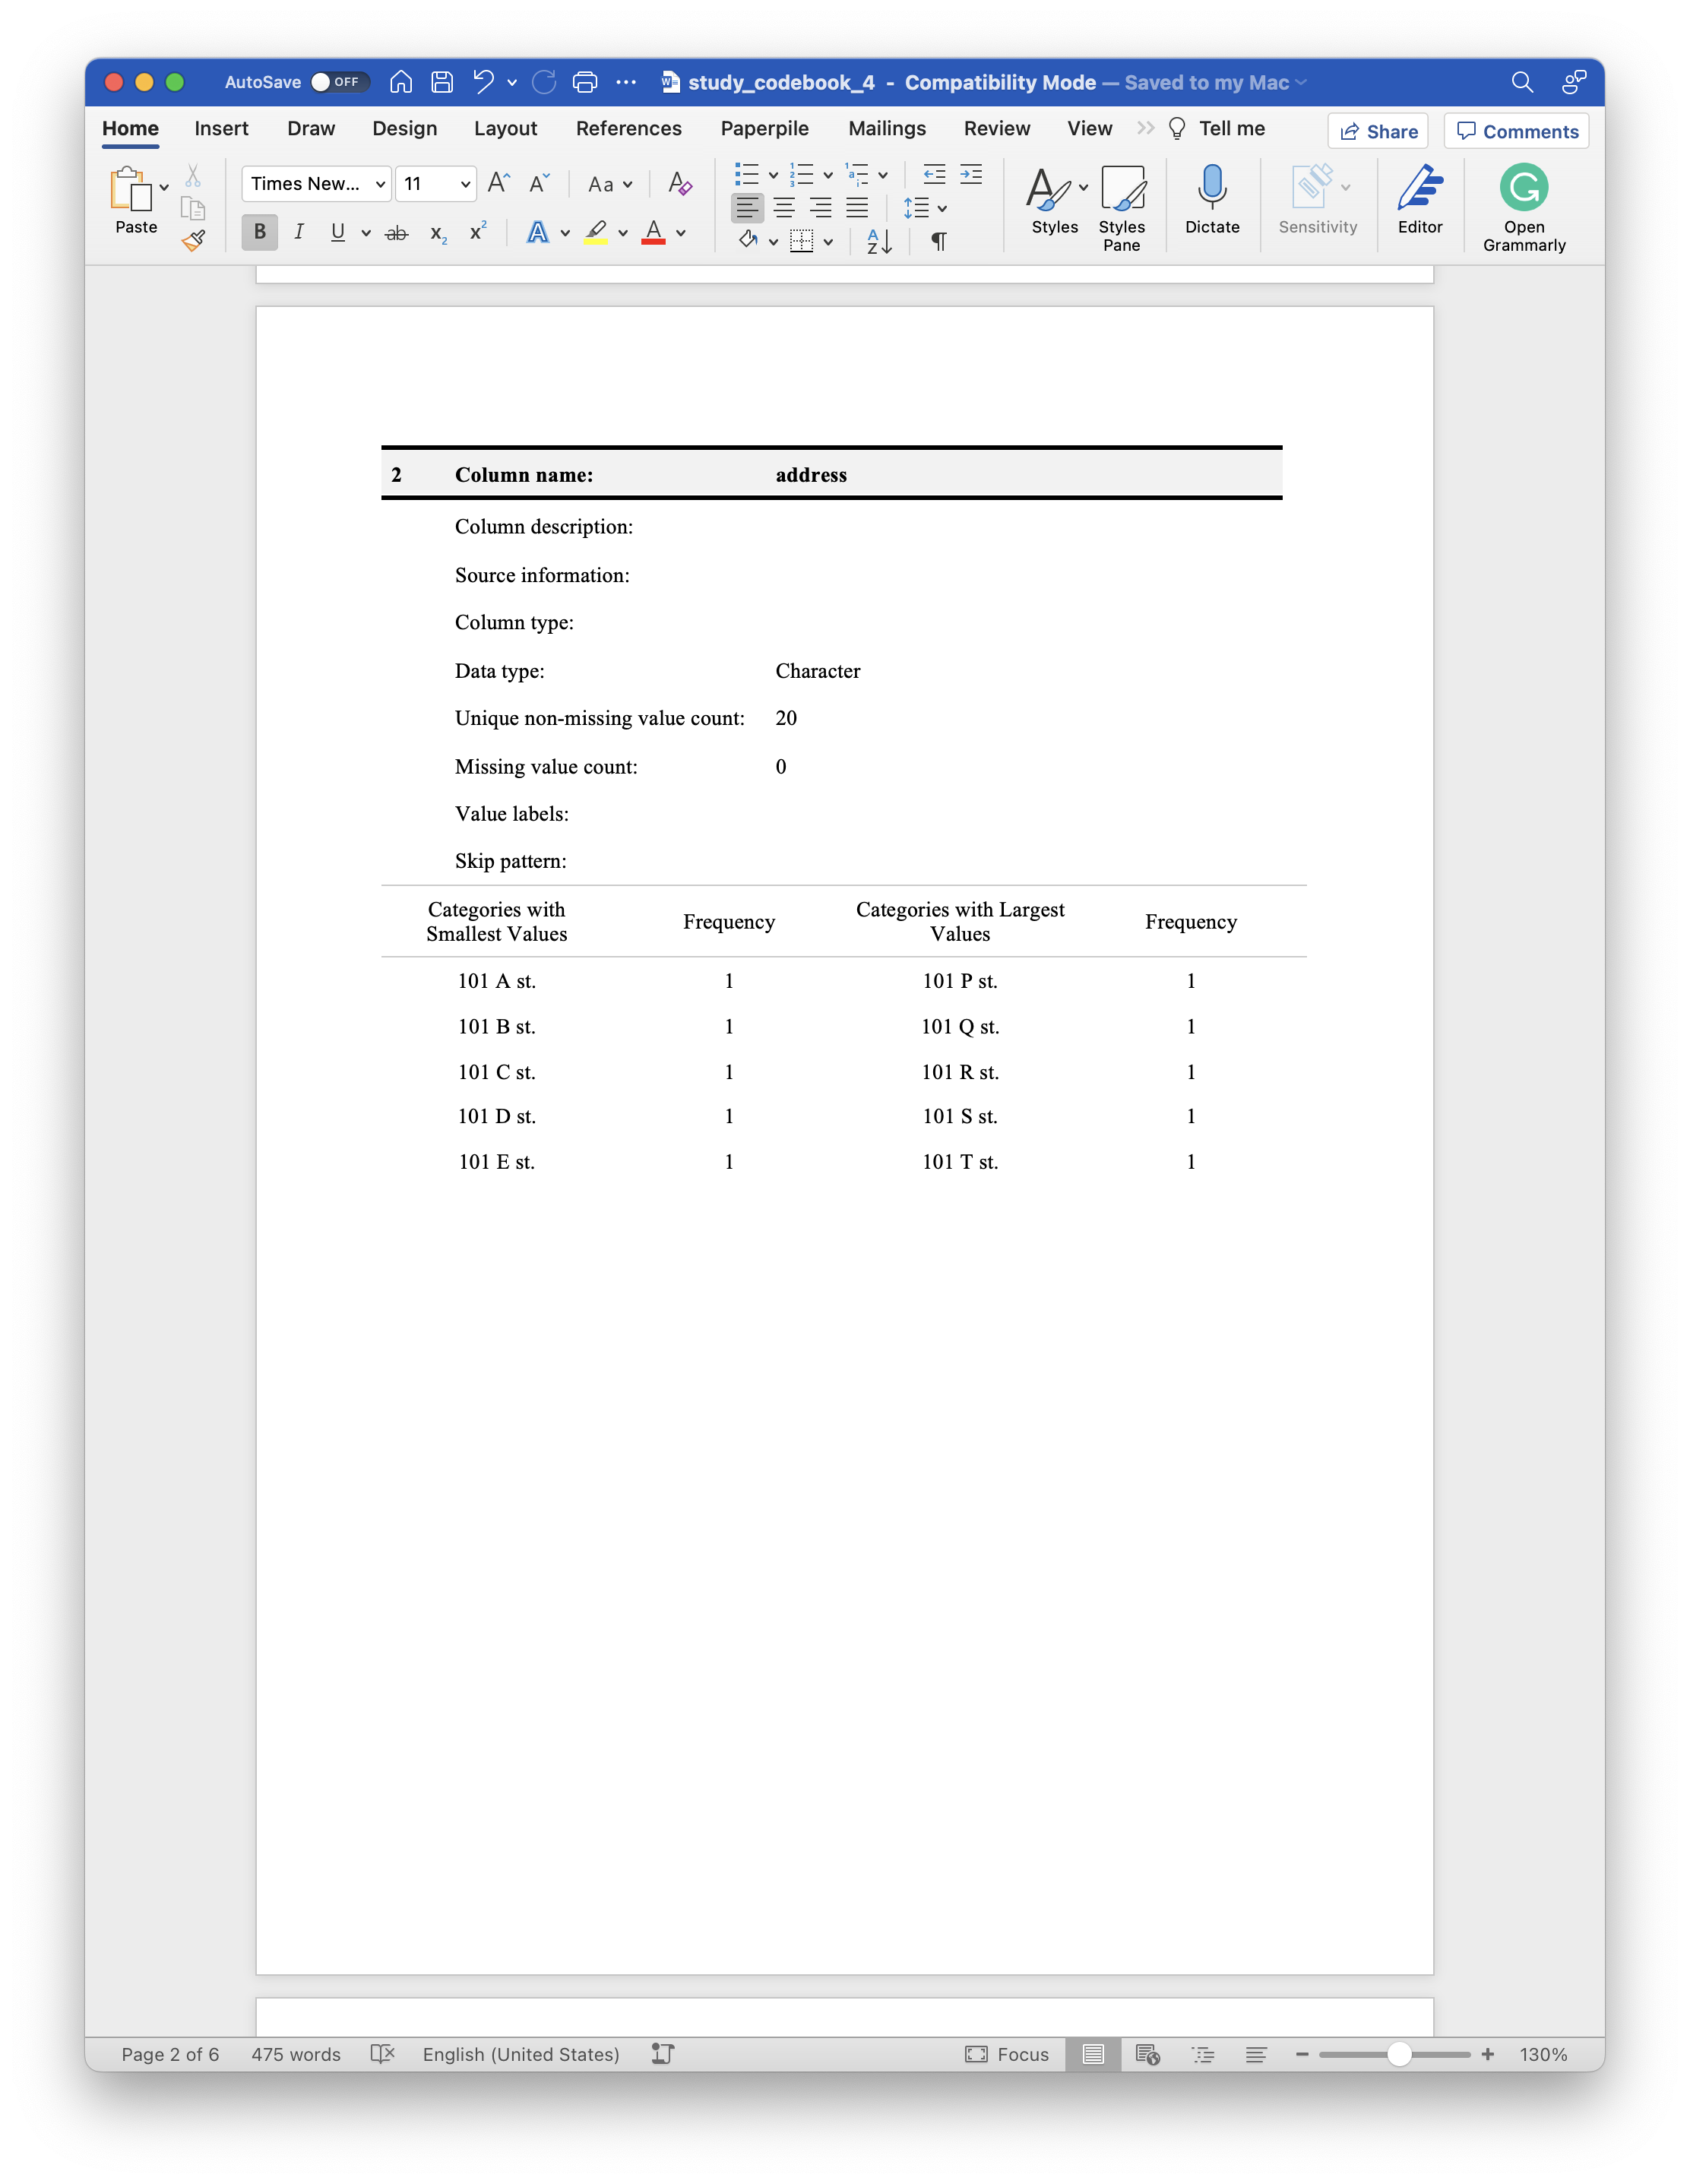
print(study_codebook, "study_codebook_4.docx")The code above produces the following document, which you can click to view/download on Dropbox. You may also download it from the files pane above.
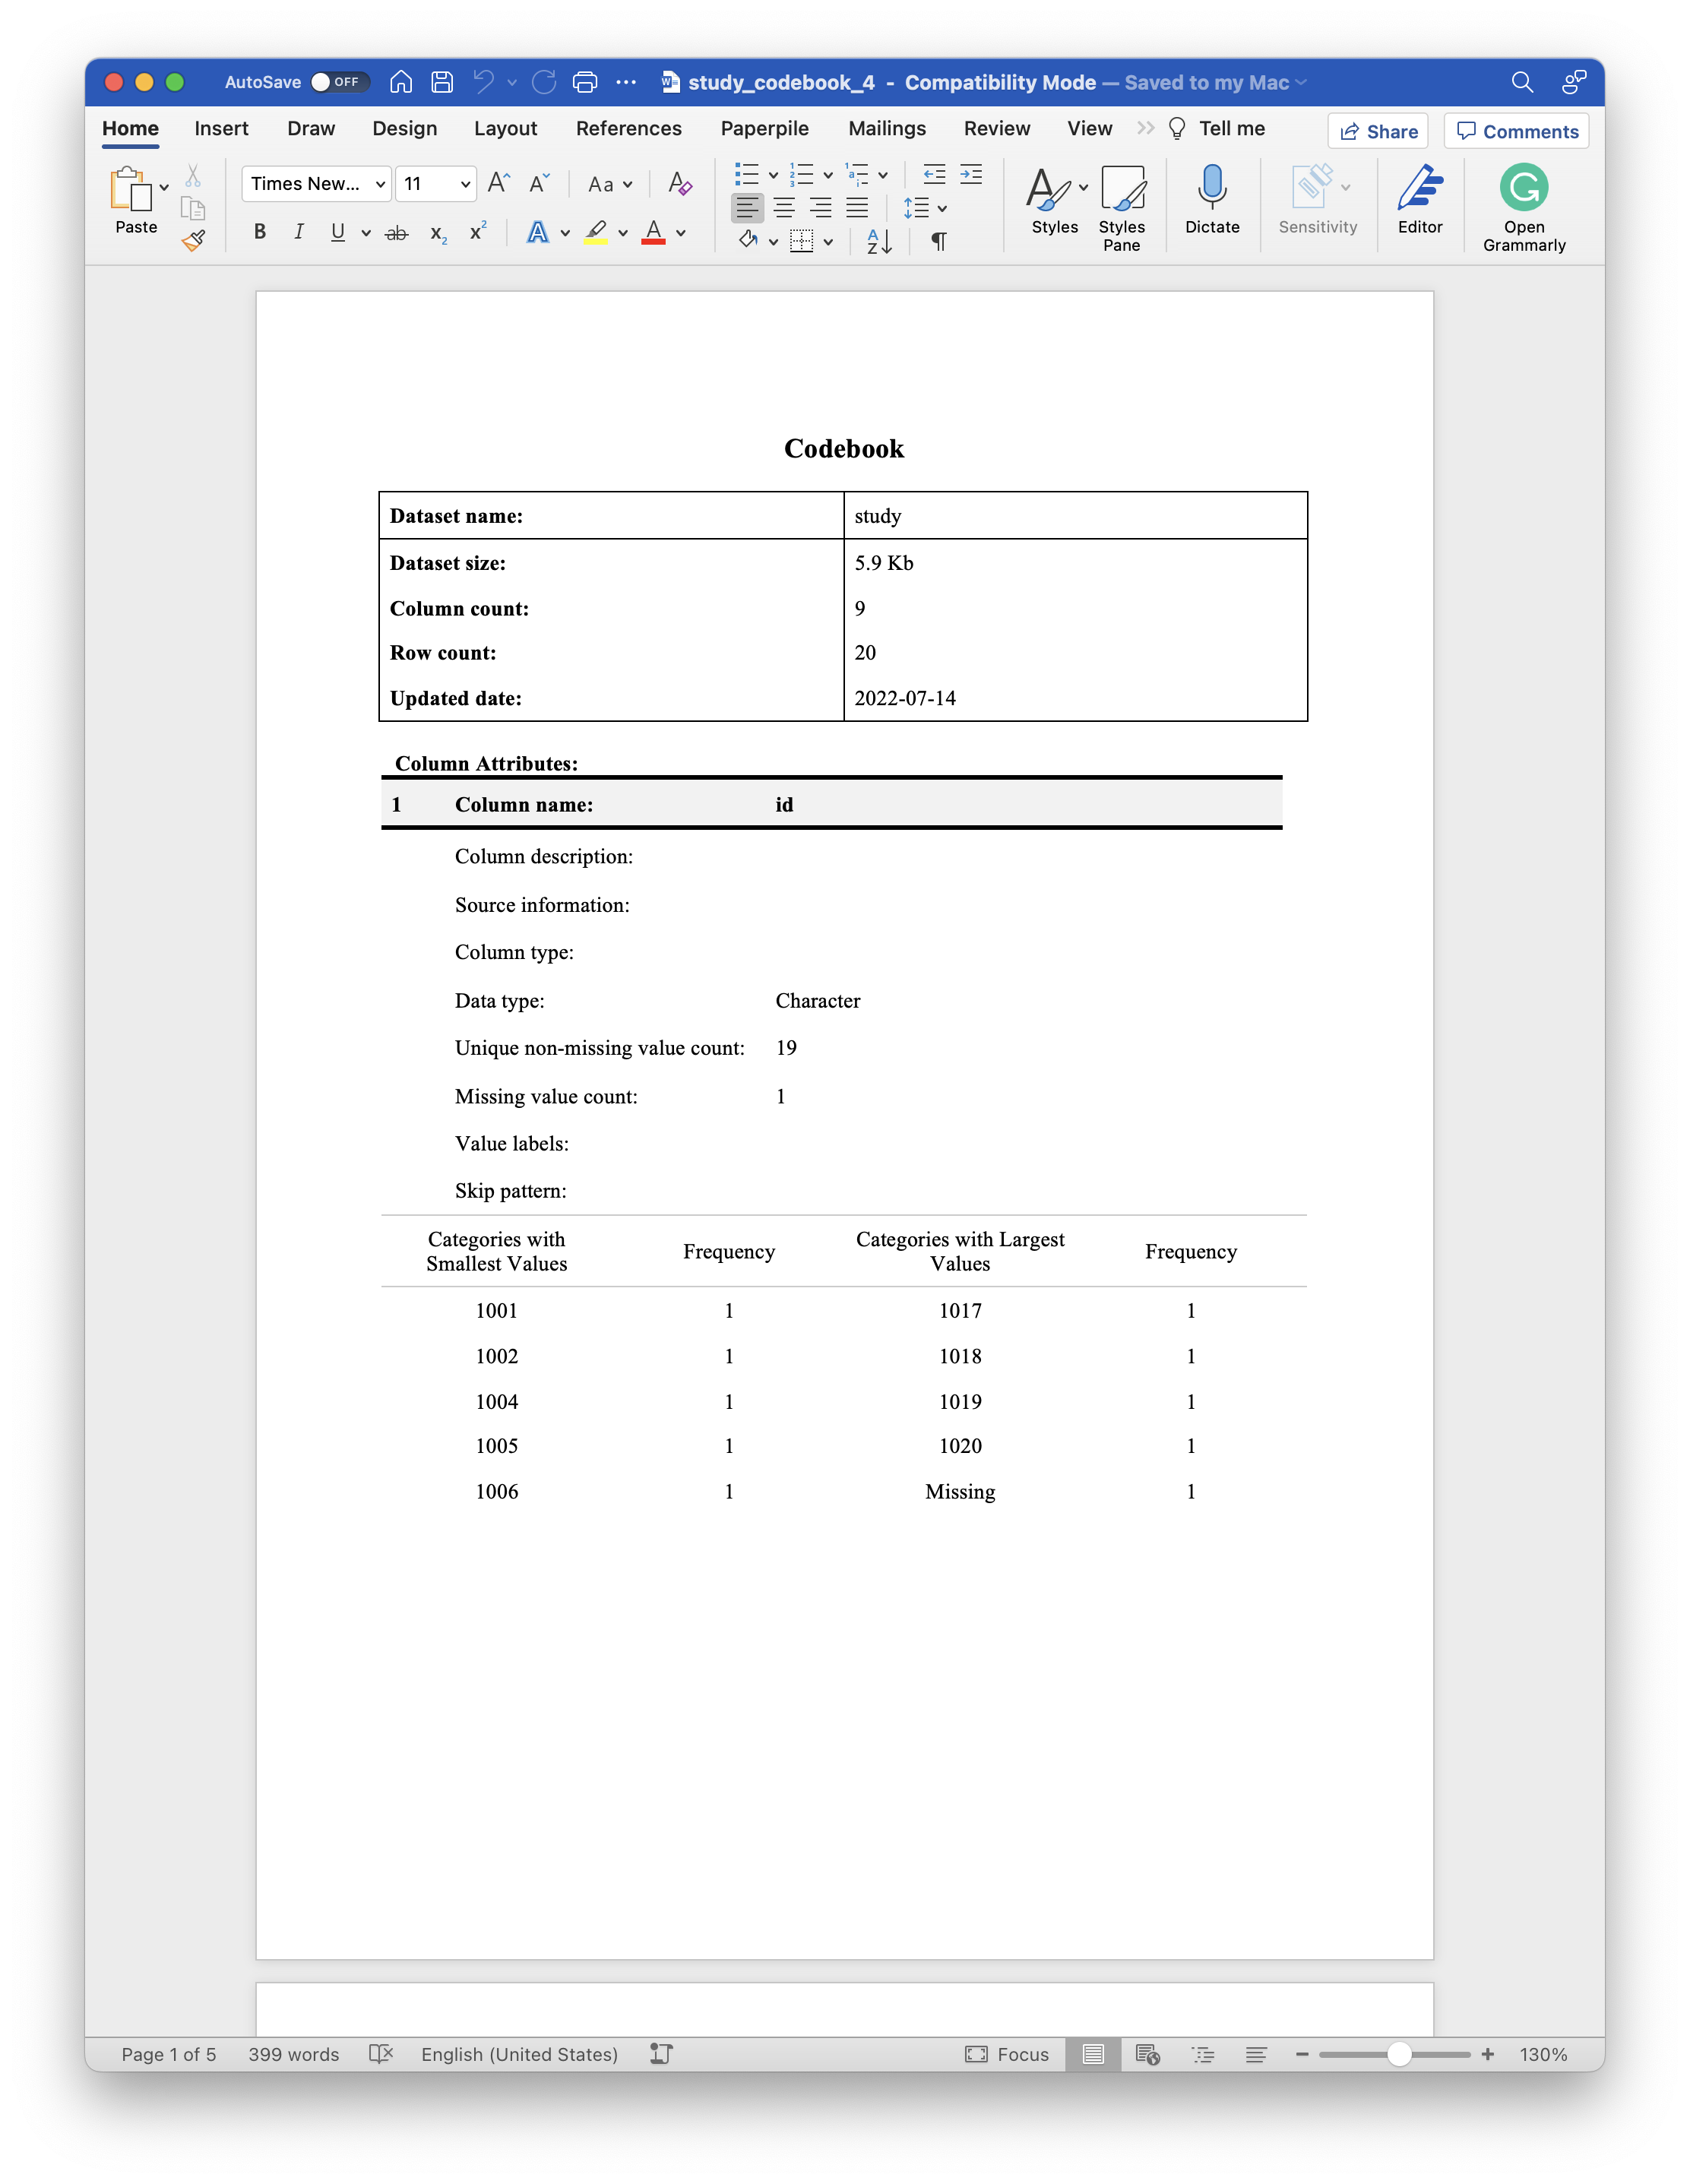
As shown in the screenshot above, all rows of the column attributes table now exist in the codebook document for each column of the data frame. However, the values are blank where relevant attributes were not set.
Preventing summary statistics from appearing in the column attributes table
There may be times when a column contains values that are sensitive or may be used to identify individual people (e.g., names, addresses, etc.) and the individual values for that column should not appear in the codebook. For example, the study data includes an address column. If we wanted to make the codebook for the study data available to the public, but not the data itself, we may not want the individual addresses to show in the summary statistics portion of the column attributes table as they do by default.
Of course, we could just drop the address column from the data frame entirely, but it’s better to have the codebook acknowledge all of the columns that exist in the data frame. In cases like this, we can pass a character vector of column names to the no_summary_stats argument of the codebook() function. Doing so will prevent the summary statistics from being added to column attributes table for any column passed to this argument.
study_codebook <- codebook(study, no_summary_stats = "address")
print(study_codebook, "study_codebook_5.docx")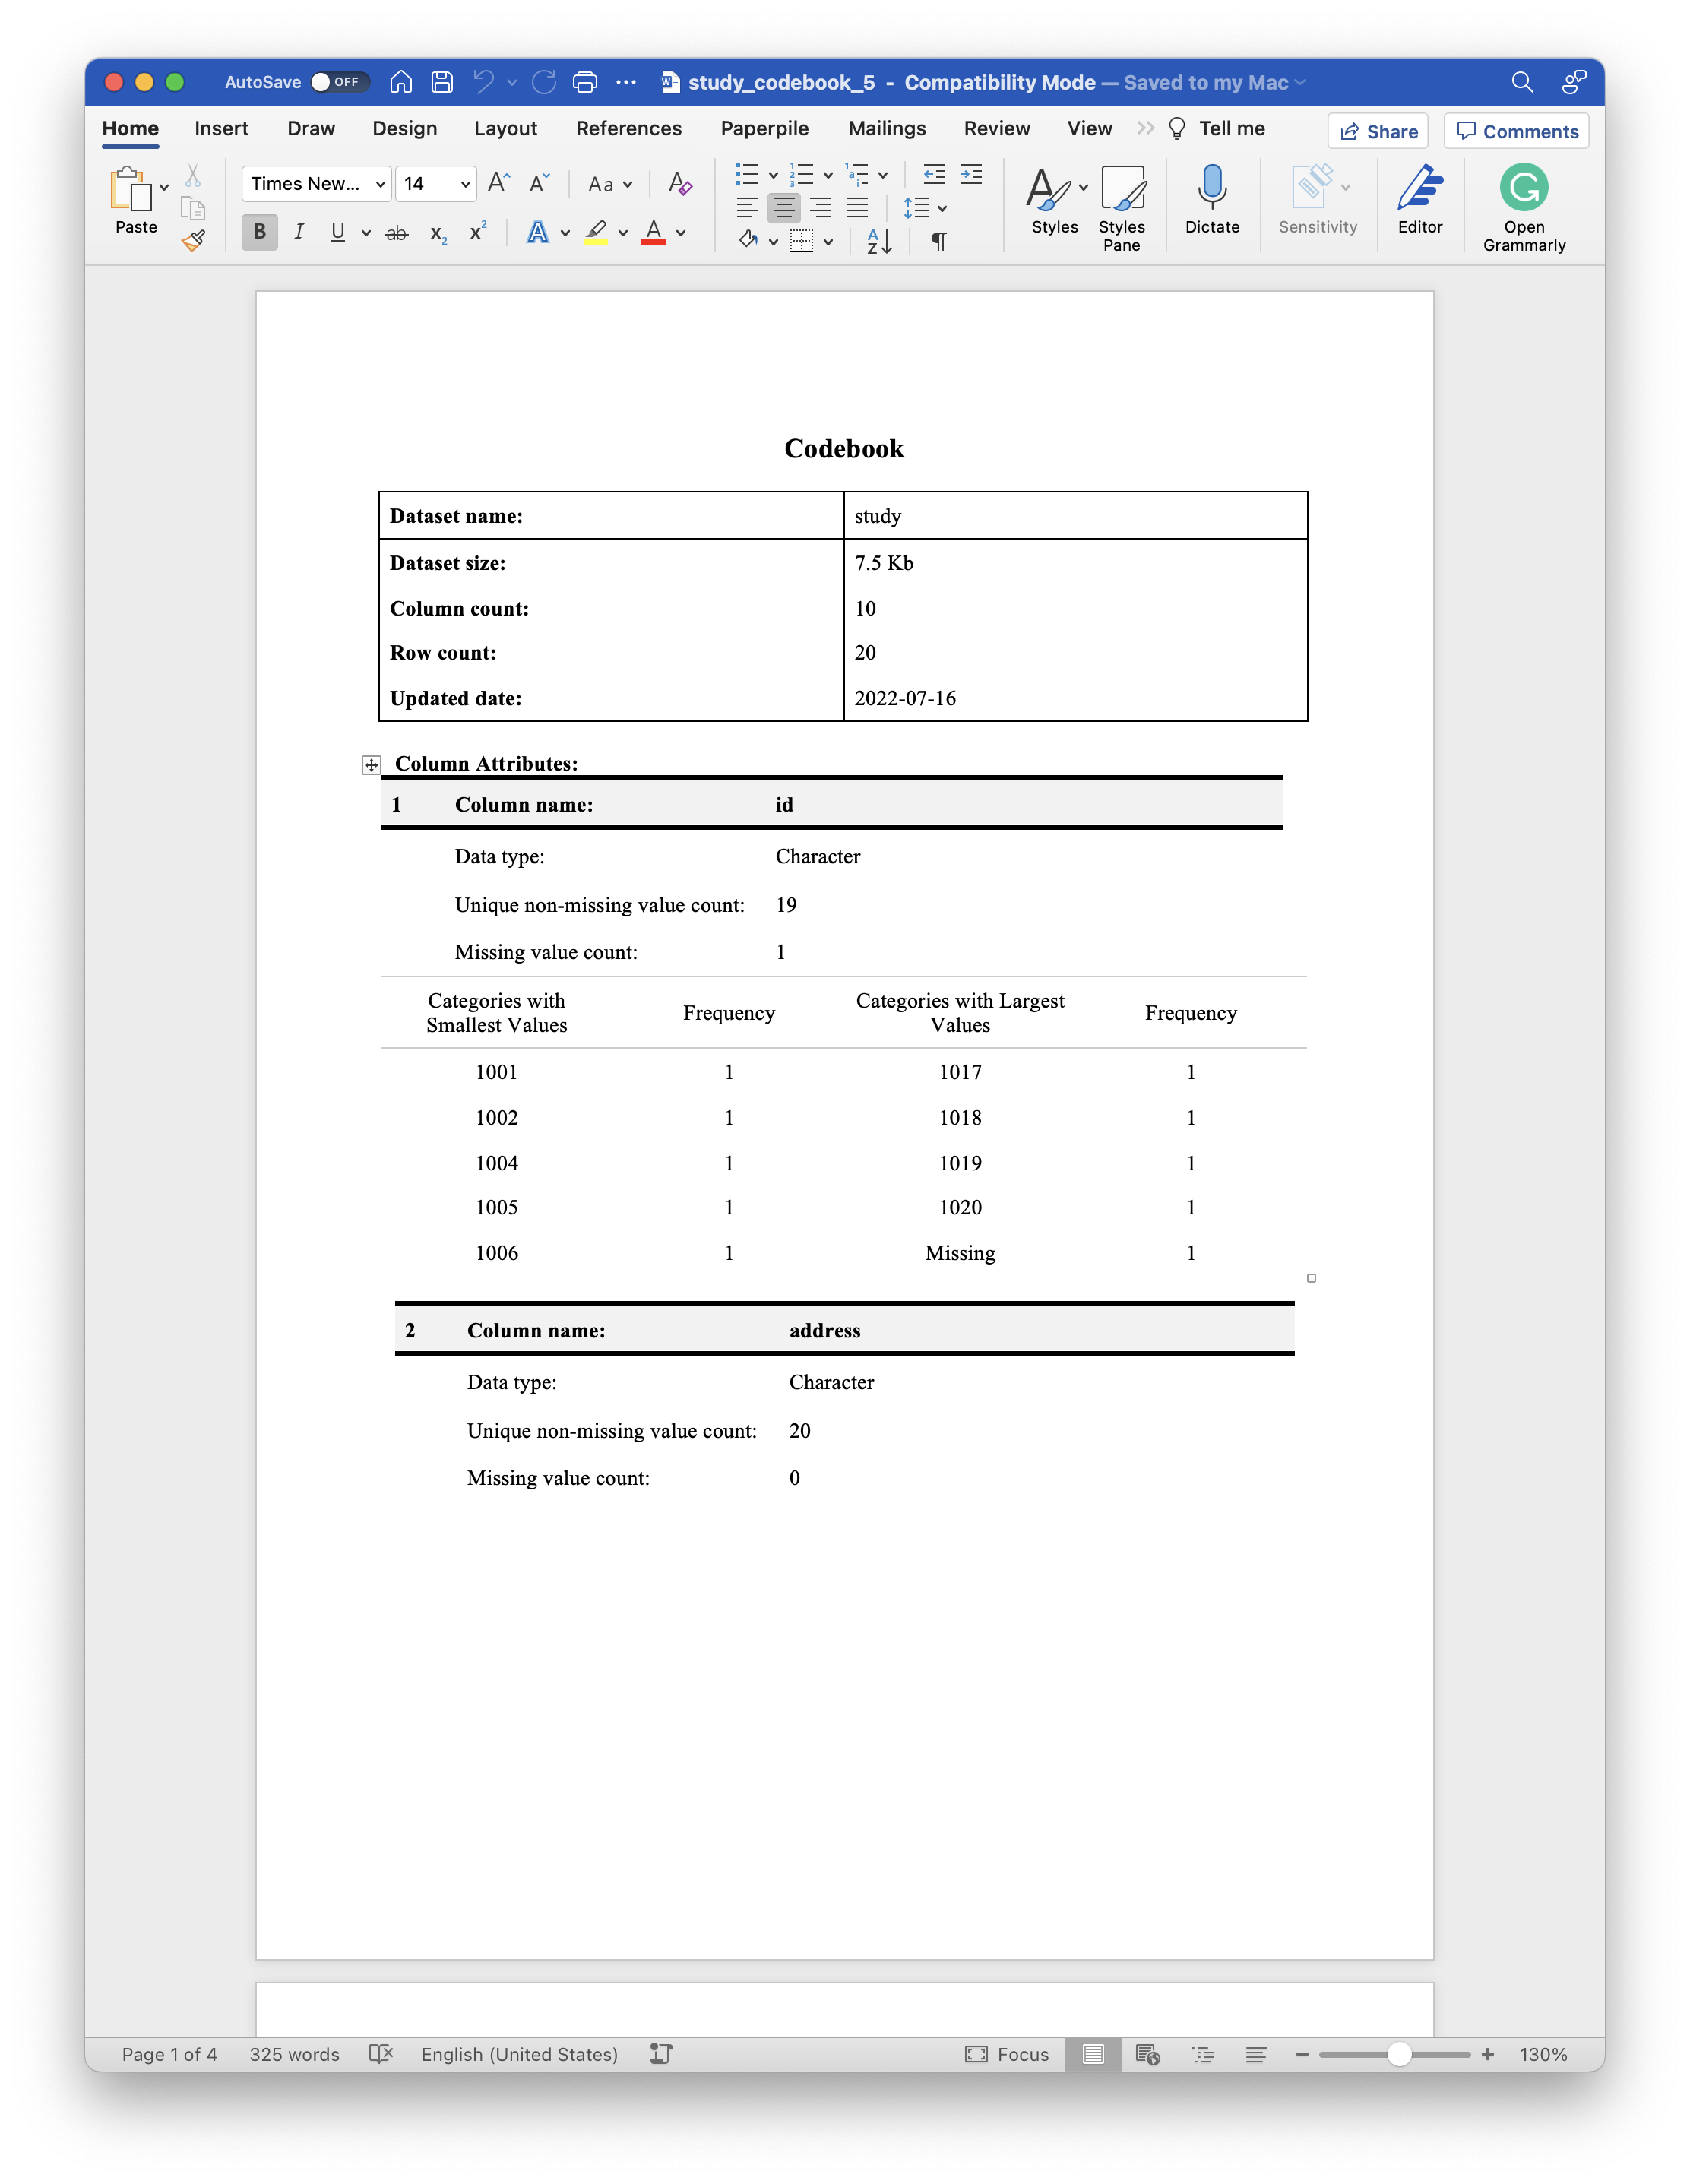
As shown in the screenshot above, the column attributes table for the address column no longer shows any of the individual addresses.
Further, we can omit the summary statistics for all of the columns in our data frame using the following code.